DLCs#
Work in progress. Currently just exporting the plots.
Release Count Analysis#
Release Count Distribution
Percentage of games with (game) DLCs: ‘9.02%’
DLC (non-zero) count distribution#
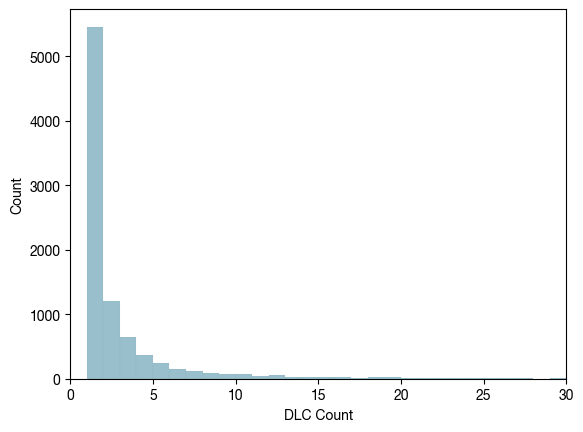
Fig. 11 DLC count distribution for games with DLCs#
DLC Count Factors#
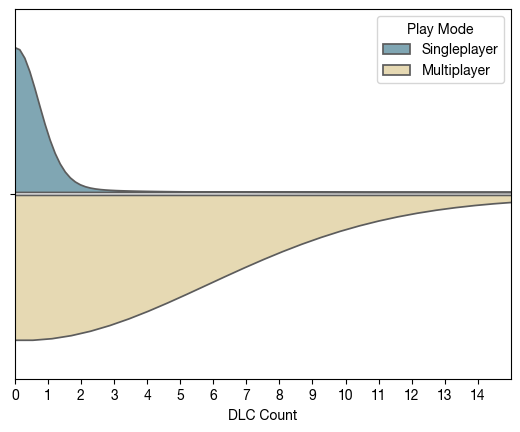
Out of 52214 singleplayer games, ‘8.83%’ have DLCs, while out of 10480 multiplayer games ‘13.90%’ have DLCs
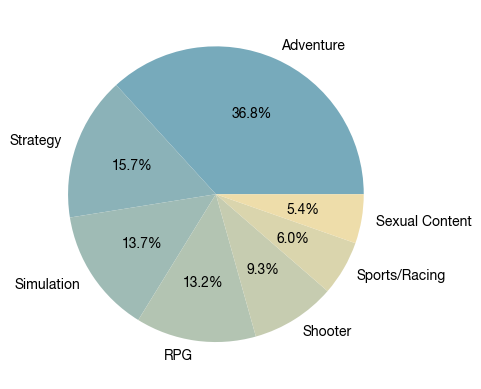
Fig. 12 Genre distributions#
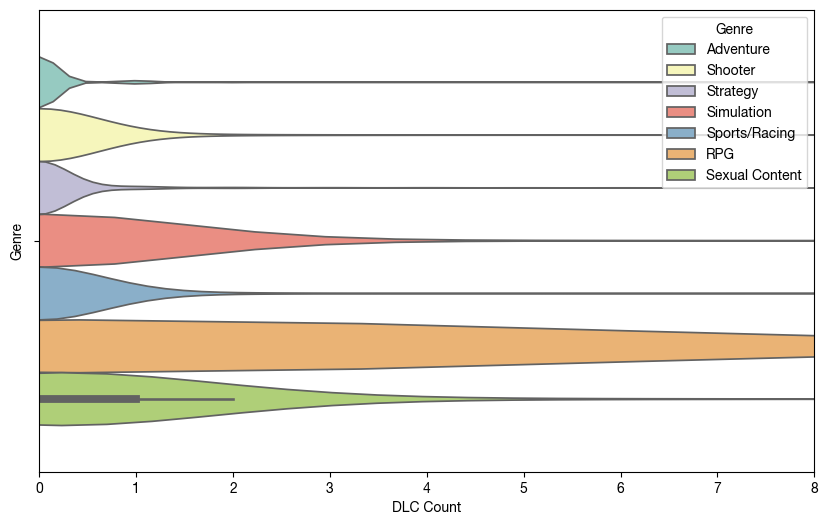
Fig. 13 DLC count distributions by genre#
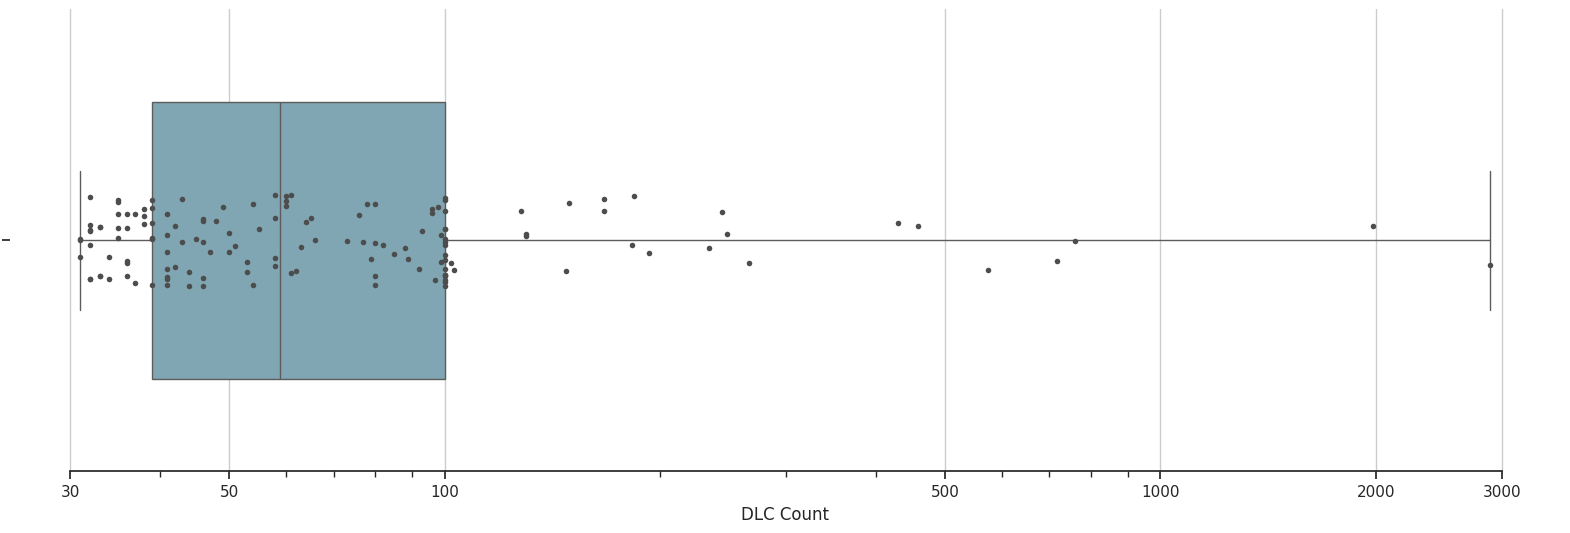
Fig. 14 Distribution of DLC count extrema (30+ DLCs)#
Tag Analysis of Games with 100+ DLCs#
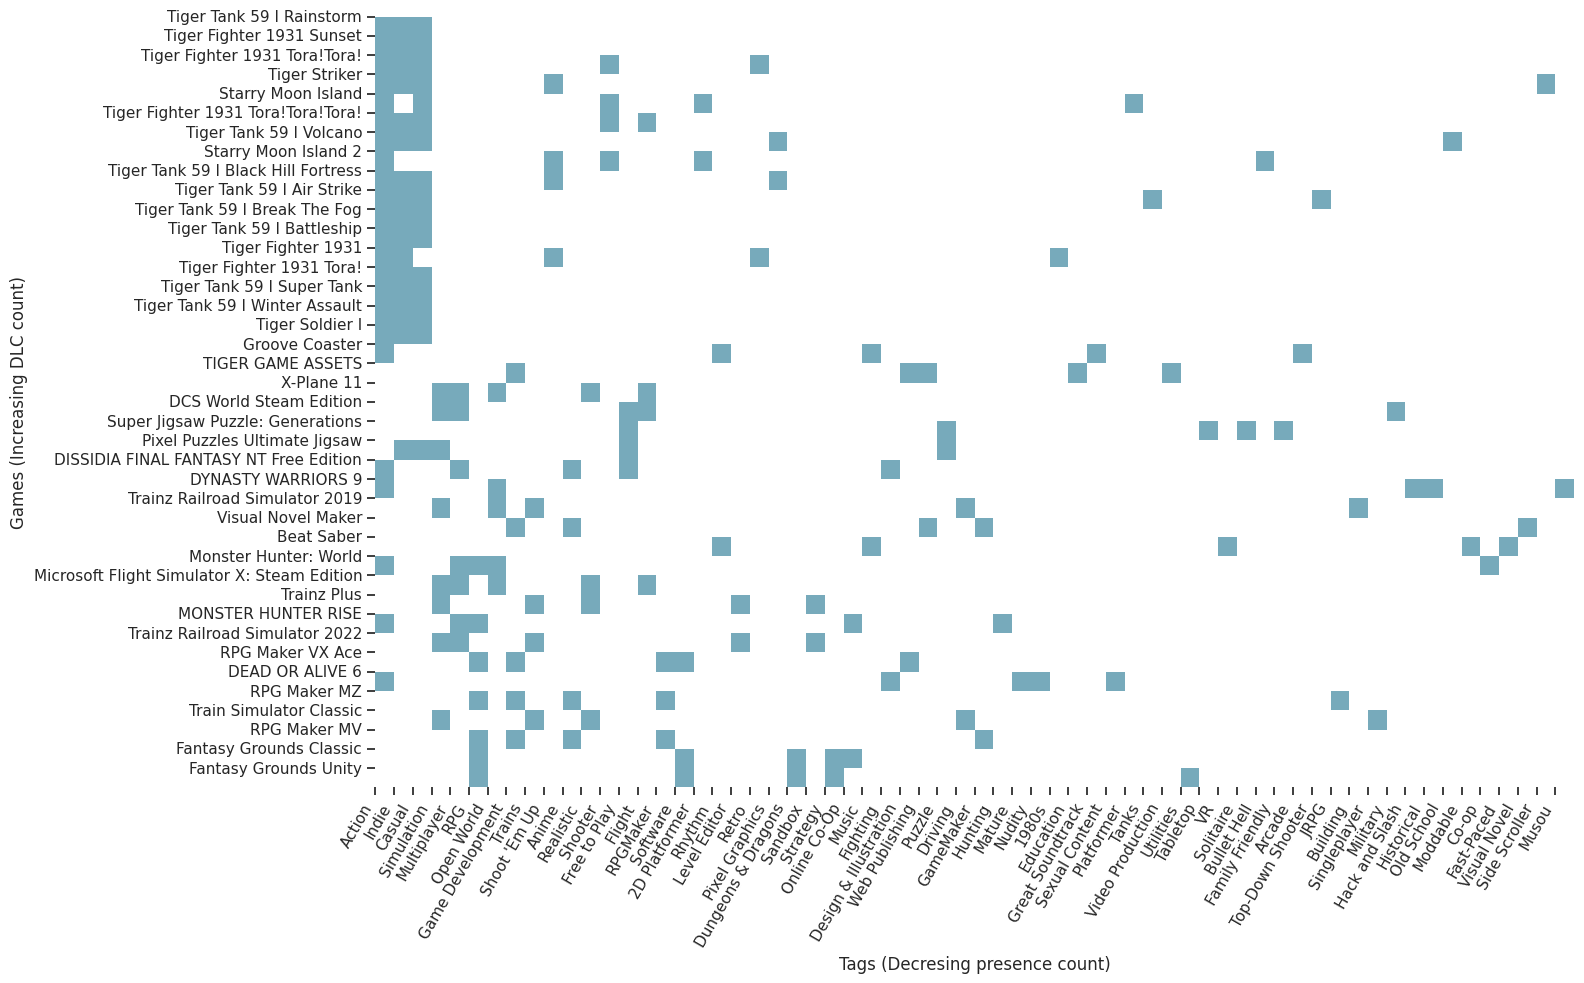
Fig. 15 Tag presence for games with 100+ DLCs#
We can the bottom half of the games, those exactly on the 100 DLC boundary all have “Tiger” in their name, these are all made by the same developer (TigerQiuQiu) and each include 100 map packs as DLC. We redo the plot excluding these games to get a better representation of tag presence:
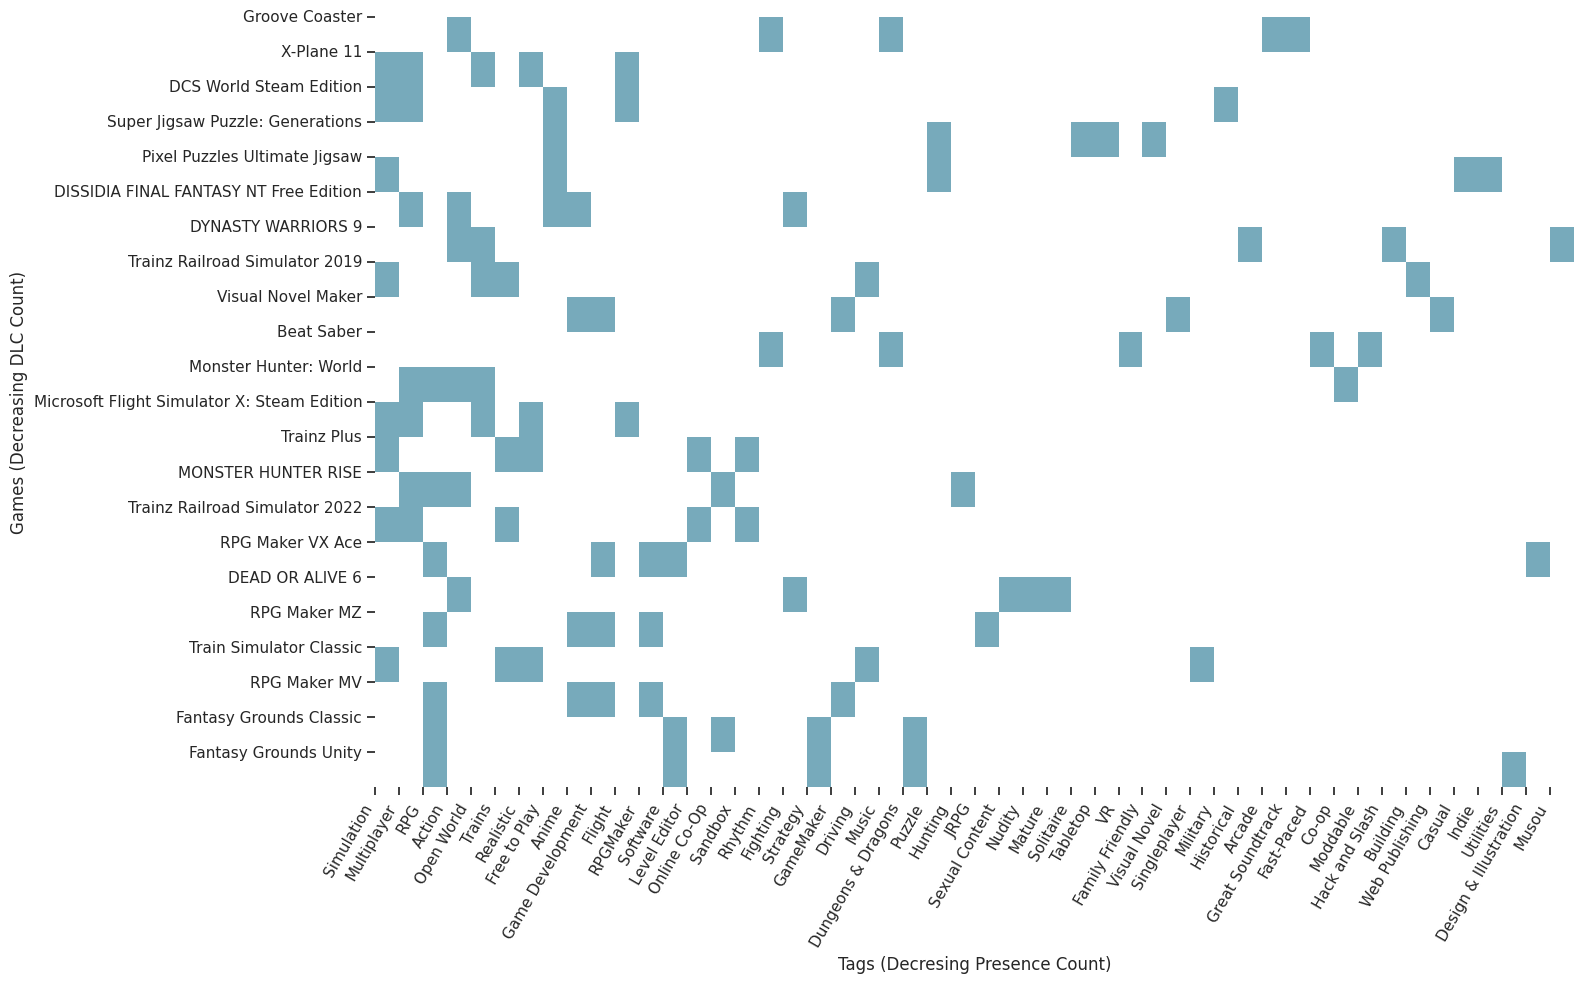
Fig. 16 Tag presence for games with 100+ dlcs (Exluding ‘TigerQiuQiu’ Developer)#
Average DLC Price Distribution#
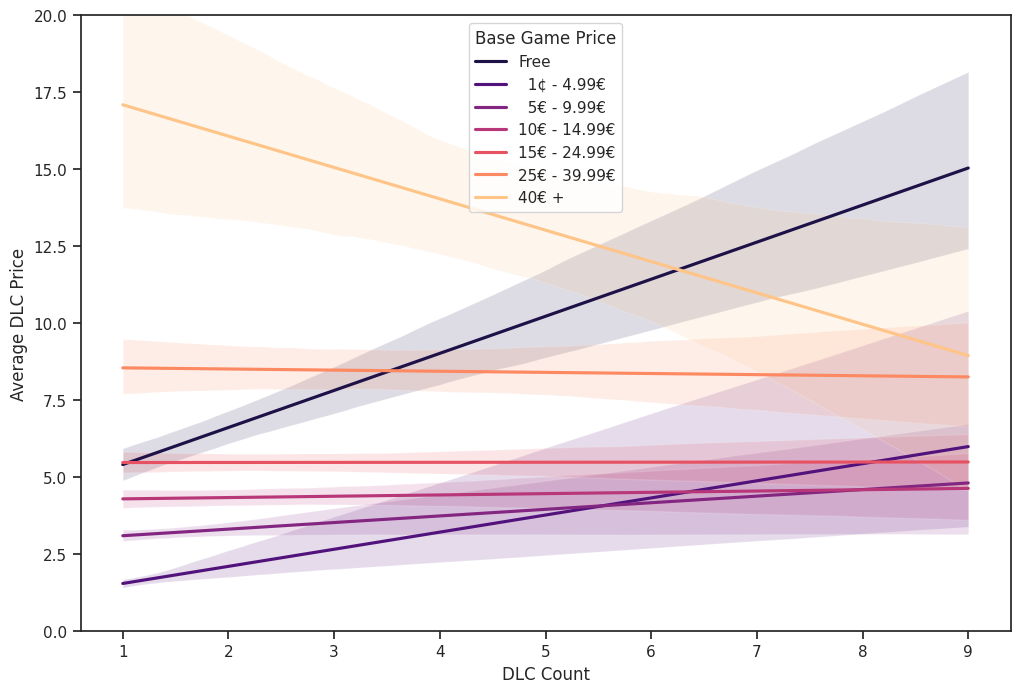
Fig. 17 Linear fits for Average DLC Price per Number of DLCs, Grouped by Base Game Price#
DLC Release Time Distributions#
Let us graph the distribution of DLC’s release date in days after the base game’s release.
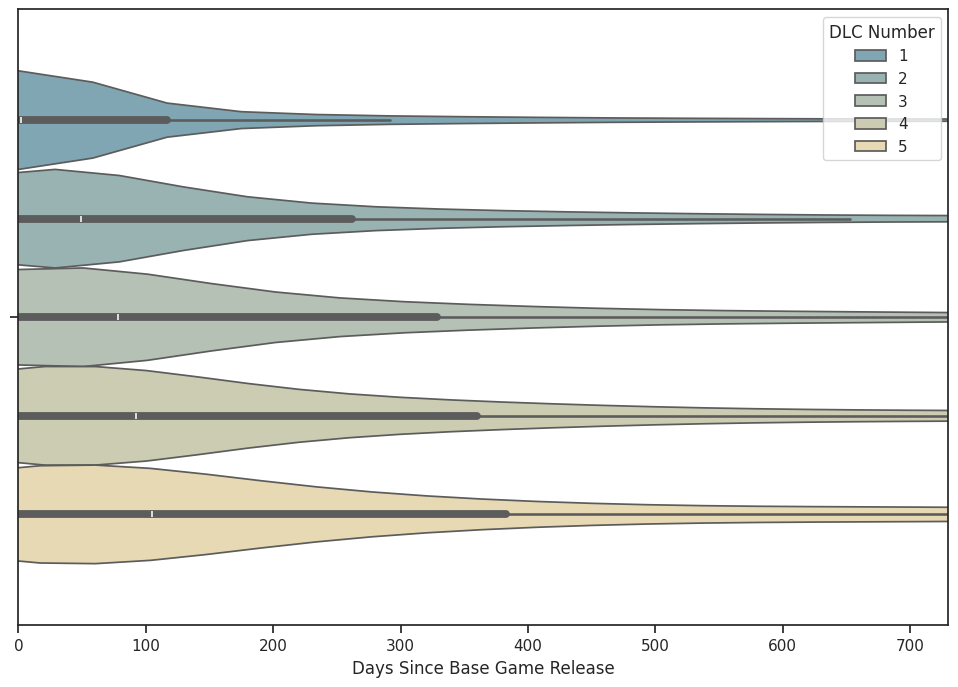
Fig. 18 DLC release date offsets from base game#