Overview#
The following are general global results of the steam-explorer project, capturing the global gaming landscape based on the 4,482,631 cumulative datapoints gathered in November 2023. For more in-depth analysis, view any of the following chapters.
Global Metrics#
products are listed on the steam store
B
C
D
E
F
Releases#
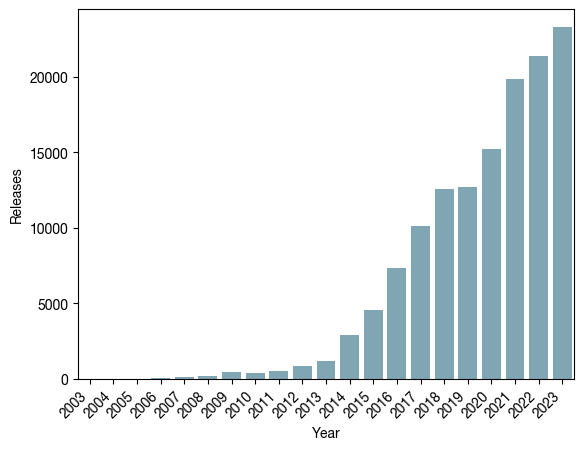
Steam has been a globally successful gaming platform; currently housing over 100,000 games. Since its mainstream debut, developers have kept increasing the number of yearly releases—a testament to the growth of the gaming landscape as a whole. 2023 saw 23,310 game releases, which equates to 67 game releases per day.
| Year | Release Count | YoY % Diff |
|---|---|---|
| 1997 | 2 | nan |
| 1998 | 1 | -50.0 |
| 1999 | 2 | 100.0 |
| 2000 | 2 | 0.0 |
| 2001 | 4 | 100.0 |
| 2002 | 1 | -75.0 |
| 2003 | 3 | 200.0 |
| 2004 | 6 | 100.0 |
| 2005 | 8 | 33.3 |
| 2006 | 70 | 775.0 |
| 2007 | 119 | 70.0 |
| 2008 | 204 | 71.4 |
| 2009 | 443 | 117.2 |
| 2010 | 413 | -6.8 |
| 2011 | 537 | 30.0 |
| 2012 | 839 | 56.2 |
| 2013 | 1153 | 37.4 |
| 2014 | 2926 | 153.8 |
| 2015 | 4587 | 56.8 |
| 2016 | 7360 | 60.5 |
| 2017 | 10138 | 37.7 |
| 2018 | 12582 | 24.1 |
| 2019 | 12698 | 0.9 |
| 2020 | 15228 | 19.9 |
| 2021 | 19883 | 30.6 |
| 2022 | 21404 | 7.6 |
| 2023 | 23310 | 8.9 |
Early Beginnings
Steam’s debut on September 12, 2003 saw relatively slow adoption from the developer side. Besides hosting Valve’s previously released titles, such as Counter Strike: Source and Half-Life, in its first two years, the platform only saw 14 from other developers. However 2006 saw the platform’s first step into the spotlight, with 64 external titles including those from the Call of Duty, Sid Meir’s Civ, and Total War franchises. The platform would then see ever-increasing adoption from developers until its explosion in 2014, possibly caused by a rapid increase in the playerbase following Counter Strike: Global Offensive’s “Arms Deal” update.
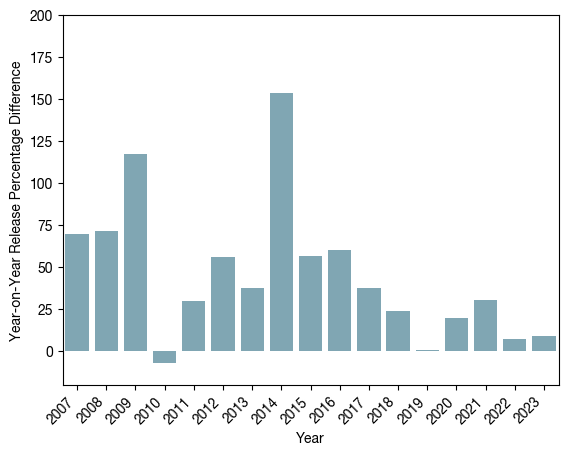
An Unperturbed Giant
Steam’s release count has generally seen a year-over-year increase. However 2019’s data is a clear outlier amongst this growth. The end of 2018 saw the release of Epic Games’ competing “Store”. The meteoric rise of Fortnite, along with exclusivity deals on the Epic Games’ store such as Borderlands 3 resulted in 108 million customers on the competing platform. On the developer side, Epic Games presented a more generous 88%/12% revenue split compared to Valve’s 70%/30%, however exlusivity for the first 6 months in their platform netted developers publishing on Epic Games Store 100% of the revenue.
TODO: 2020-2022 analysis
Game Genres#
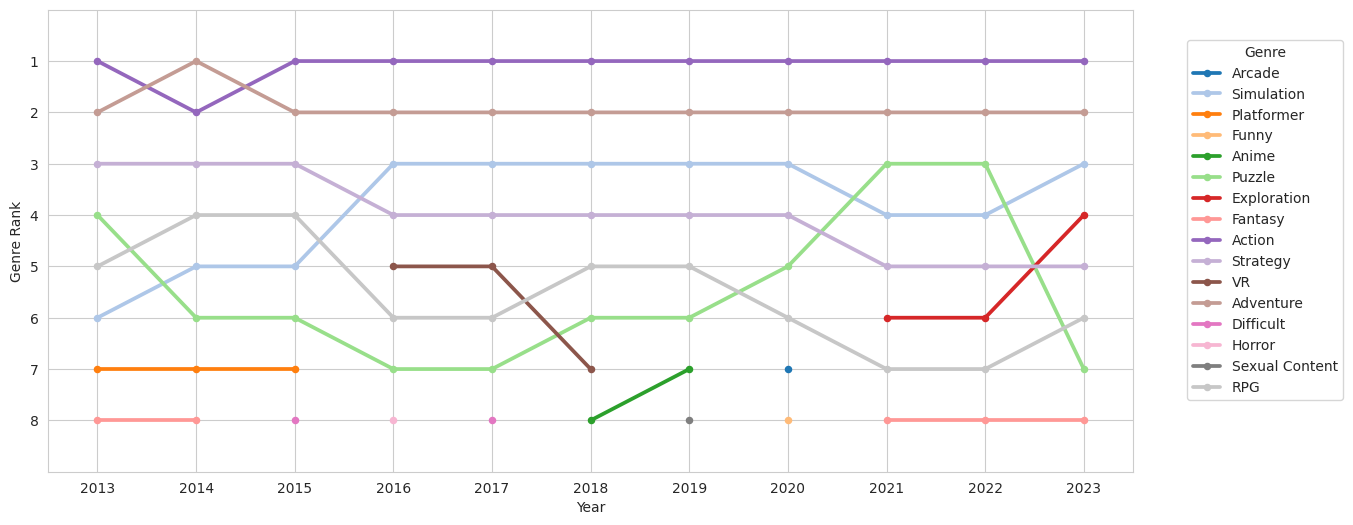
Fig. 4 Top 8 most popular game genres by releases per year#
| Year | Genre | Rank |
|---|---|---|
| 2003 | Strategy | 1 |
| 2003 | Shooter | 2 |
| 2004 | FPS | 1 |
| 2004 | Shooter | 3 |
| 2005 | RPG | 2 |
| 2006 | Strategy | 2 |
| 2006 | Simulation | 3 |
| 2007 | Shooter | 2 |
Fig. 5 Non Action/Adventure genres in the top 3 ranking between 2003 and 2007#
Fig. 4 showcases the rankings of gameplay-related genres (collected via tags) in the past 10 years. There is a strong stability in the two most popular tags, Action and Adventure, which within Fig. 6 one can see stems from a large gap in counts between the top two and the remaining tags. The top two tags are not surprising, both largely being “meta-genres” for which games could easily also contain other genres shown in the figures. Adventure’s top spot is indicative of the similarities between videogames and other common forms of narrative content in the entertainment industry such as literature and film. Looking further in the past shows that this wasn’t always the case. Fig. 5 showcases non Action/Adventure genres within the top 3 between 2003 and 2007. It is likely that the Adventure genre required improvements in consumer hardware as well as further technological advancements in software development before it could cement its place, as seen by the appearance of other genres within the top spots within this timeline.
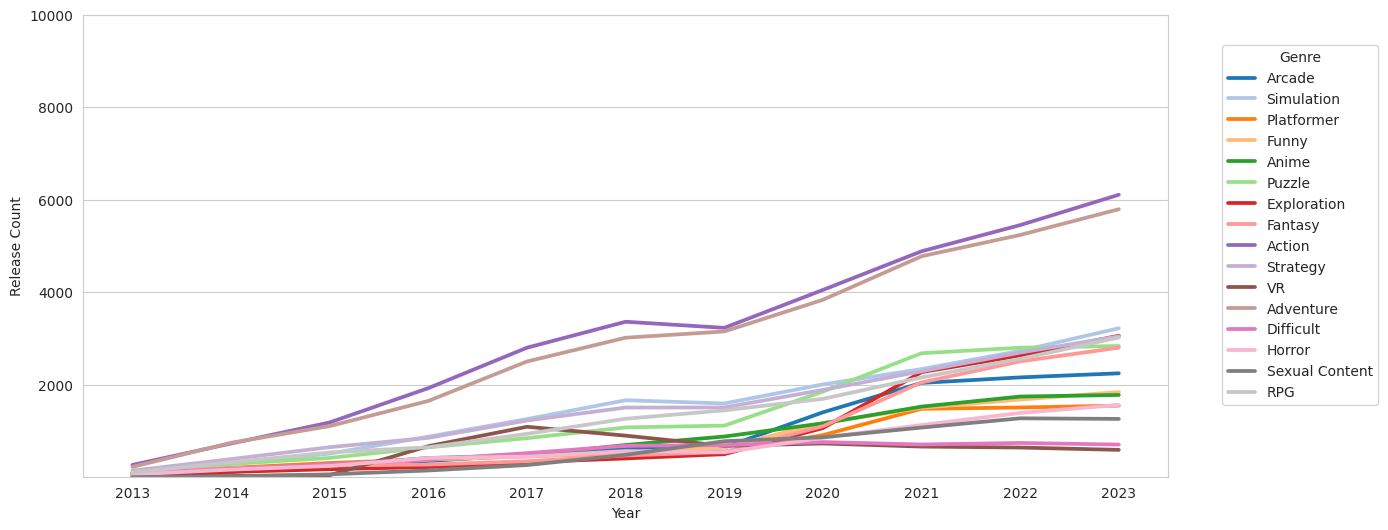
Fig. 6 Top 8 most popular game genres by releases per year#
Virtual Atrophy
| Genre | Rating |
|---|---|
| Simulation | 0.65 |
| VR | 0.65 |
| Strategy | 0.67 |
| RPG | 0.68 |
| Action | 0.69 |
| Adventure | 0.7 |
| Fantasy | 0.75 |
| Puzzle | 0.77 |
| Anime | 0.78 |
Fig. 7 Average release ratings by genre within releases in 2016-2017#
An immediate standout in Fig. 6 is the VR genre, which unlike all other tags, has had a visible decline in releases since its peak popularity in 2017. The modern VR genre came about with the release of the Oculus Rift in April 2012, which the data suggests had a slow adoption, likely due to its high entry cost for the average consumer. VR games greatly incresed in popularity in 2016 alongside the release of the HTC Vive (which was partly developed by Valve). One can speculate that the general appeal of the new technology along with the heavy marketing would result in the influx of releases in 2016-2017, but a lack of long term retention due to poor reception resulted in the decline of the genre. We can see in Fig. 7 that amongst other top ranking genres, VR had one of the lowest average ratings.
Platform Support#
The Windows operating system is the de facto standard within the gaming community, with MacOS and Linux support being far from mainstream adoption.
(header bar)
of games support Windows
(header bar)
of games support MacOS
(header bar)
of games support Linux
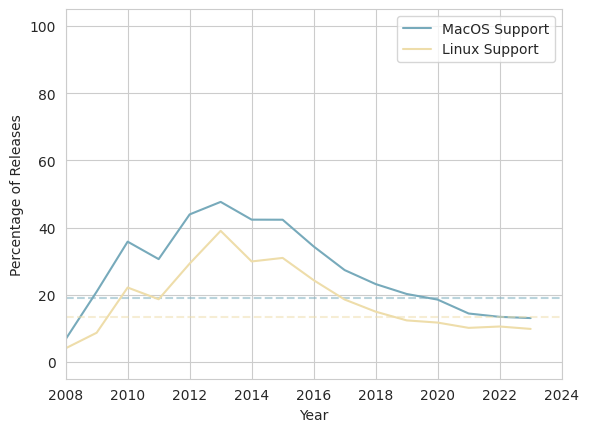
Fig. 8 Platform support as a percentage of yearly releases#
Platform support for MacOS and Linux has been on the decline since
DLCs and Demos#
(header bar)
of games contain DLCs.
Here is some accompanying text
Number of DLCs, Game-DLC percentage
Highest number of DLC
Publishers and Developers#
Average number of games per developer
Most popular developer / publishers
Playercounts#
Most popular games
pandemic / seasonal changes
Pricing#
price increase or decrease? (YoY, kind)
average pricing by tags/genres (lowest and priciest tags)
Hardware Requirements#
average computer cost for a genre
steam survey comparison
Hello